RESOURCE
Blog Series - Part 1: Understanding the Java memory model
Blog Series: Optimizing Java Performance: A Deep Dive into Memory Management
July 17, 2024

**This article is the first installment in our 3-part series on "Optimizing Java Performance: A Deep Dive into Memory Management" written by our Software Developer, Katsiaryna Auchynnikava.
ENGIN™, an asset analytics accelerator, provides utility asset management planners with a powerful tool to gather the insights they need for their entire power system. ENGIN™ accelerates all the analytical workflows required for planning, and models the system of interconnected assets, from generating source to customer load that brings forward the intel that utilities need to make better business decisions.
Java continues to be a cornerstone in enterprise-level and large-scale application development, and is one of the core technologies used within our application. Achieving optimal performance and efficient memory management remains crucial as users expect applications to be fast, responsive, and reliable. Performance optimization and memory management are not just about making applications run faster; they are about ensuring stability, reducing costs, and improving the overall user experience.
Introduction
This article series explores the fundamental concepts of Java memory management, highlights common pitfalls, and offers practical techniques to enhance the performance of your Java applications. Today’s topic is background about the Java memory model: understanding the types of memory and how memory is freed up and cleared by different garbage collectors.
Java Memory Management
Java Memory Model
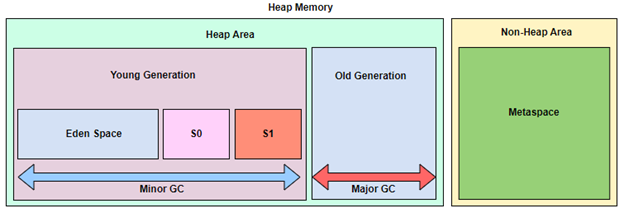
Java divides its memory into three main areas: Stack, Heap and Metaspace:
1. Stack: The stack is used to store temporary data, such as primitive variables. Objects themselves are not stored directly in the stack; instead, their references are stored here. Each thread has its own stack, working with a FILO (First In Last Out) data structure, making it the most efficient region since Java can easily manage the stack’s lifecycle for each thread.
2. Heap: This area is dedicated to storing objects, with its memory managed by the Garbage Collector (GC). The Heap is segmented into different regions to efficiently handle the lifecycle of objects.
Objects are stored and managed by the Garbage Collector (GC).
- Young Generation: This section is intended for newly instantiated objects, designed to undergo frequent garbage collection to enhance memory management for transient objects. It is further broken into:
- Eden Space: The starting zone for new objects, where the majority are short-lived and swiftly reclaimed by the GC.
- Survivor Spaces (S0 and S1): Objects that persist through the initial collection in Eden Space. These areas serve as transitional phases where objects can shuttle between them before being elevated to the Old Generation, depending on their age and endurance through multiple GC cycles.
- Old Generation: This area stores objects that have remained alive through numerous GC cycles in the Young Generation. It is determined to be less frequent but more through the collection process, often termed “Major GC” or “Full GC”. This region basically has a larger allocation to house more durable and significant objects.
3. Metaspace: This area is designated for storing permanent data, such as static fields and class metadata. Unlike other memory regions, it is not subject to garbage collection because its contents need to be accessible throughout the application’s lifecycle. Located in native memory, Metaspace replaced the older Permanent Generation (PermGen) starting with Java 8. It can dynamically expand, preventing out-of-memory errors associated with class metadata and static fields.
These memory segments allow Java applications to function efficiently by classifying data based on its anticipated duration in memory, thereby optimizing garbage collection and ensuring more consistent performance.
Garbage Collection Mechanisms
Java garbage collection comes in two types: Minor Garbage Collection and Full garbage Collection.
Minor Garbage Collection: This occurs whenever the Eden Space becomes full and needs to be cleared. Minor GC is quick and targets the Young Generation, running frequently to maintain efficient memory usage.
Major Garbage Collection: When objects are garbage collected from the Old Generation, it is a Major Garbage Collection Event. It is triggered when the Old Generation starts getting full. Full GC should be avoided if possible to keep your application responsive, as it can cause noticeable pauses in application performance.
Consider the following sequence as an example:
1. Initially, Eden contains both live and dead objects.
2. When Minor GC occurs, all dead objects are cleaned up from the Eden and all live objects are transferred to S0 (FromSpace). Eden and S1 (ToSpace) are empty.
3. New objects are created and added to Eden. Over time, some objects in Eden and S0 become dead.
4. Another Minor GC happens, removing all dead objects from Eden and S0. All live objects are moved to S1. Now, Eden and S0 are empty again.
This process repeats several times. If an object continues to be used after several cycles, the subsequent garbage collection will move it to the Old Generation space.
Types of Garbage Collectors
Garbage collection makes Java memory efficient because it removes the unreferenced objects from heap memory and makes free space for new objects.
The Java Virtual Machine (JVM) offers some garbage collectors, each tailored for specific scenarios:
Serial Garbage Collector
Ideal for small applications in single-threaded environments. The main point of this GC is that it only uses one thread, so GC can take a long time. It's suitable for background processes or applications that don't need to be highly responsive. The advantage of this garbage collection is that it doesn't consume as many resources compared to other GC types.
Parallel Garbage Collector
The Parallel Garbage Collector, also known as the throughput collector, employs multiple threads to manage garbage collection tasks and can benefit from reduced garbage collection pause times due to its multi-threaded approach. It utilizes the same underlying algorithms as the Serial Garbage Collector: the Copying algorithm for the Young Generation and the Mark-Sweep-Compact algorithm for the Old Generation. This parallelism accelerates the garbage collection process and reduces the duration of stop-the-world events, where the application is paused for garbage collection. By utilizing multiple threads, the Parallel Garbage Collector can handle larger heaps more efficiently, making it suitable for applications that require high throughput and minimal pause times.
Since Java 8, the popularity of the Parallel Garbage Collector has decreased with the introduction of more advanced garbage collectors like the Garbage First (G1) Collector and the Z Garbage Collector (ZGC). These newer collectors offer better performance and more predictable pause times for a wider variety of applications, making them preferable for modern Java applications.
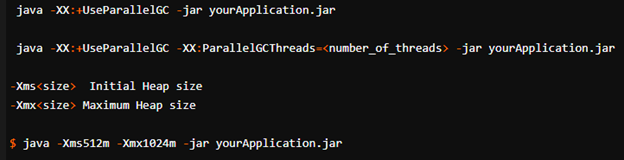
Configuration Options:
Enabling of Parallel GC:

Setting the number of GC threads:

Heap size configuration:
G1 (Garbage-First) Garbage Collector
The G1 (Garbage First) Garbage Collector is designed to address the limitations of previous garbage collectors in Java, offering a balance between high throughput and low pause times. It was introduced to replace both the CMS (Concurrent Mark-Sweep) and the Parallel Garbage Collectors. G1 GC divides the heap into equal-sized regions (from 1 to 32 MB, with up to 2048 regions), which can contain either Young Generation or Old Generation objects. This division allows more flexible and efficient memory management. G1 GC performs many of its operations concurrently with the application threads, reducing pause times significantly. It uses parallel threads to speed up the garbage collection process, which enhances throughput. The G1 Garbage Collector is designed for modern applications requiring high performance, low pause times, and efficient memory management. It provides a balanced approach to garbage collection, making it suitable for a wide range of Java applications.
Configuration Options:
To enable G1 GC and set a target pause time:

Heap region size:

G1 Mixed GC Parameters:

ZGC Garbage Collector
The Z Garbage Collector (ZGC) is a versatile and high-performance, low-latency garbage collector introduced in Java 11 and became production-ready starting with Java 21. It is designed to handle applications with very large heaps and aims to keep pause times short and predictable, even as heap sizes grow to terabytes.
ZGC targets pause times below 10 milliseconds, regardless of heap size. This makes it suitable for applications requiring high responsiveness and minimal disruption due to garbage collection. ZGC can efficiently manage heaps ranging from a few megabytes to multiple terabytes. This scalability is crucial for large-scale applications and services. Most of ZGC's work is done concurrently with the running application, reducing the need for long stop-the-world (STW) pauses. It uses multiple threads to parallelize garbage collection tasks, enhancing performance. ZGC uses colored pointers to store metadata about objects directly within the pointers themselves. This approach helps in tracking object state and ensuring consistency without significant overhead. ZGC employs load and store barriers to maintain memory consistency during concurrent operations. These barriers help manage references and ensure that the garbage collector can work efficiently without halting the application.
Configuration Options:
To enable ZGC with a target pause time:

Setting maximum pause time:

Configuring Heap size:
Configure the region size:

To log ZGC-specific information:

Control the number of Concurrent GC Threads:

Concurrent Mark-Sweep (CMS) Garbage Collector
The Concurrent Mark-Sweep (CMS) Garbage Collector is designed to minimize pause times for applications that require low-latency garbage collection. Unlike traditional garbage collectors that stop application threads for extended periods, CMS performs most of its work concurrently with the application. CMS aims to reduce the duration of stop-the-world (STW) pauses, making it suitable for applications where responsiveness is critical. CMS performs several phases concurrently with the application, reducing the overall impact on application performance. CMS is primarily focused on managing the Old Generation, using a combination of concurrent and parallel phases to minimize pause times.
Configuration Options:
Enabling CMS:

Configuring Initial Mark Pause:

Configuring Concurrent Threads:

Handling Fragmentation:
- Enable compaction during CMS cycles to reduce fragmentation:

- Set the frequency of compaction:

Shenandoah Garbage Collector
It is designed to provide low pause times and efficient memory management, even with large heaps. Introduced by Red Hat and available in OpenJDK 11, Shenandoah aims to minimize stop-the-world (STW) pauses by performing most of its work concurrently with the running application. Shenandoah performs garbage collection tasks concurrently with application threads, significantly reducing pause times. Similar to the G1 GC, Shenandoah divides the heap into regions, allowing it to manage memory more flexibly and target regions with the most garbage for collection. Designed to keep pause times consistently low, typically below 10 milliseconds, regardless of heap size. Shenandoah includes concurrent compaction, which helps to avoid fragmentation and maintain a compact heap without lengthy pauses.
Configuration options:
Enabling Shenandoah:

Configuring Heap size:
Pause time target:
Concurrent Thread Configuration:

Epsilon Garbage Collector
The Epsilon Garbage Collector, introduced in JDK 11, is a no-op garbage collector designed for testing and benchmarking purposes. It performs no actual garbage collection, allowing the application to run until it exhausts the available heap memory. Epsilon does not perform any garbage collection. It allocates memory but never reclaims it, making it suitable for testing how applications behave under memory pressure. Since Epsilon doesn't reclaim memory, the heap size is fixed and determined by the initial and maximum heap size settings. Once the heap is full, the application will encounter an OutOfMemoryError. With no garbage collection overhead, Epsilon minimizes the impact on CPU usage and provides predictable performance, making it ideal for benchmarking and performance testing. Epsilon is useful for scenarios where you want to measure the memory footprint and allocation rate of an application without the interference of garbage collection pauses or overhead.
Configuration Options:
Enabling Epsilon:

Configuring Heap Size:
In our next blog, we will dive into the key metrics for garbage collection, including throughput, latency, and memory footprint. Understanding these metrics will help you tune your JVM settings and improve the performance of your Java applications.
________________________________________________________________________________________________________________________________________________________________________________
REFERENCES
1. Java Performance: The Definitive Guide by Scott Oaks
2. Java Memory Management - Oracle Documentation https://docs.oracle.com/en/graalvm/jdk/21/docs/reference-manual/native-image/optimizations-and-performance/MemoryManagement/#performance-considerations
3. Garbage-First Garbage Collector - Oracle Documentation https://docs.oracle.com/javase/8/docs/technotes/guides/vm/gctuning/g1_gc.html
4. Garbage-First Garbage Collector Tuning - Oracle Technical Resources https://www.oracle.com/technical-resources/articles/java/g1gc.html
5. An Introduction to ZGC: A Scalable and Experimental Low-Latency JVM Garbage Collector - Baeldung https://www.baeldung.com/jvm-zgc-garbage-collector
6. The Z Garbage Collector - Oracle Documentation https://docs.oracle.com/en/java/javase/21/gctuning/z-garbage-collector.html#GUID-8637B158-4F35-4E2D-8E7B-9DAEF15BB3CD
7. JVM Garbage Collectors - Baeldung https://www.baeldung.com/jvm-garbage-collectors
8. Understanding How Java's Garbage Collector Works: https://codecurated.com/blog/understanding-how-java-garbage-collector-works/
9. Introduction to Java’s Memory Model — Heap, Stack, and Metaspace - Medium: https://medium.com/@AlexanderObregon/introduction-to-javas-memory-model-heap-stack-and-metaspace-ceaeb565921c